3.2 - Uncertainty Budget in LS Spectrometry
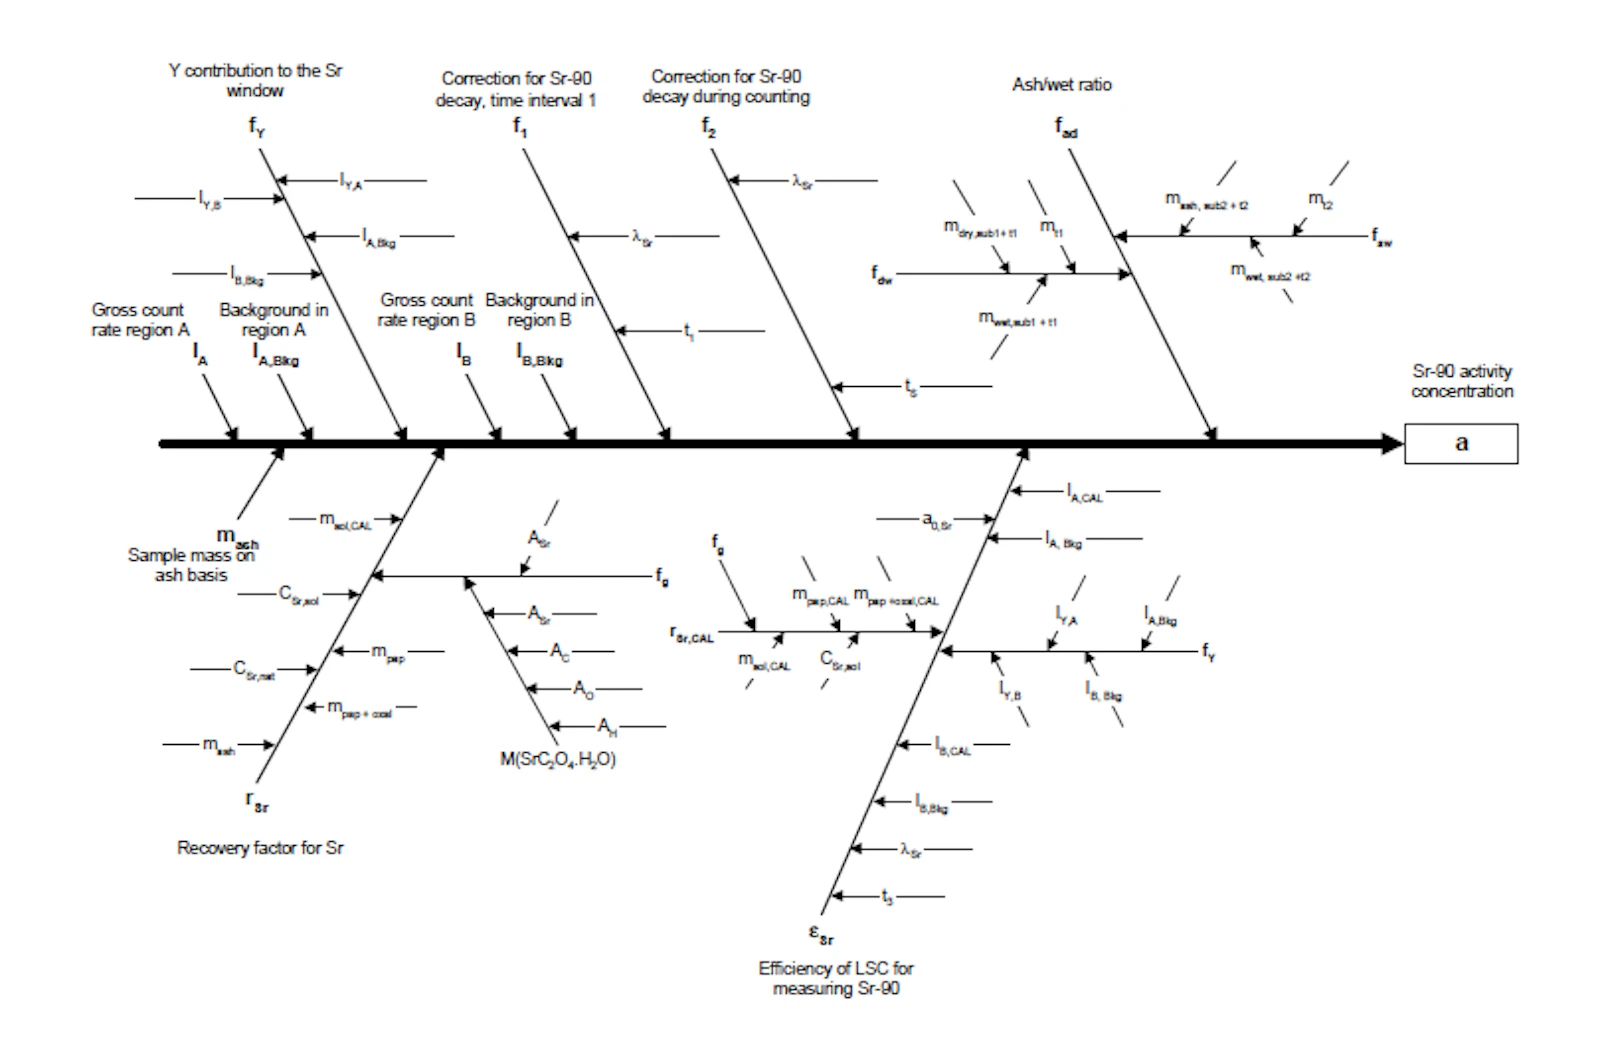
The identification and quantification of uncertainty components are critical parts of any measurement. Results without uncertainty budget are incomplete and only of low value. Even when previous chapters have shown, that LS is an effective and sensitive counting method, a number of possible variables have to be considered. They are partly also correlated amoung each other, see figure 46 for example. This applies to classical laboratory operations, but also to the calculation models for the efficiency (TDCR, CIEMAT-NIST, etc).
For the determination of natural radionuclides in air and water, LS avoids a complicated and time intensive sample preparation and consequently faults from electrolytic deposition like in α-spectrometry. Errors during sample conservation, as well as during transport to the laboratory are avoided when used as in-situ method with mobile devices. Thus, the total uncertainty of the procedure remains restricted to sampling and the measurement itself.

When chemical separation steps are part of the sample treatment, uncertainty in the calculation of the yield has to be taken into consideration. Yield calculation can be based on mass determination, addition of internal standards and/or AAS or ICP-OES measurements.
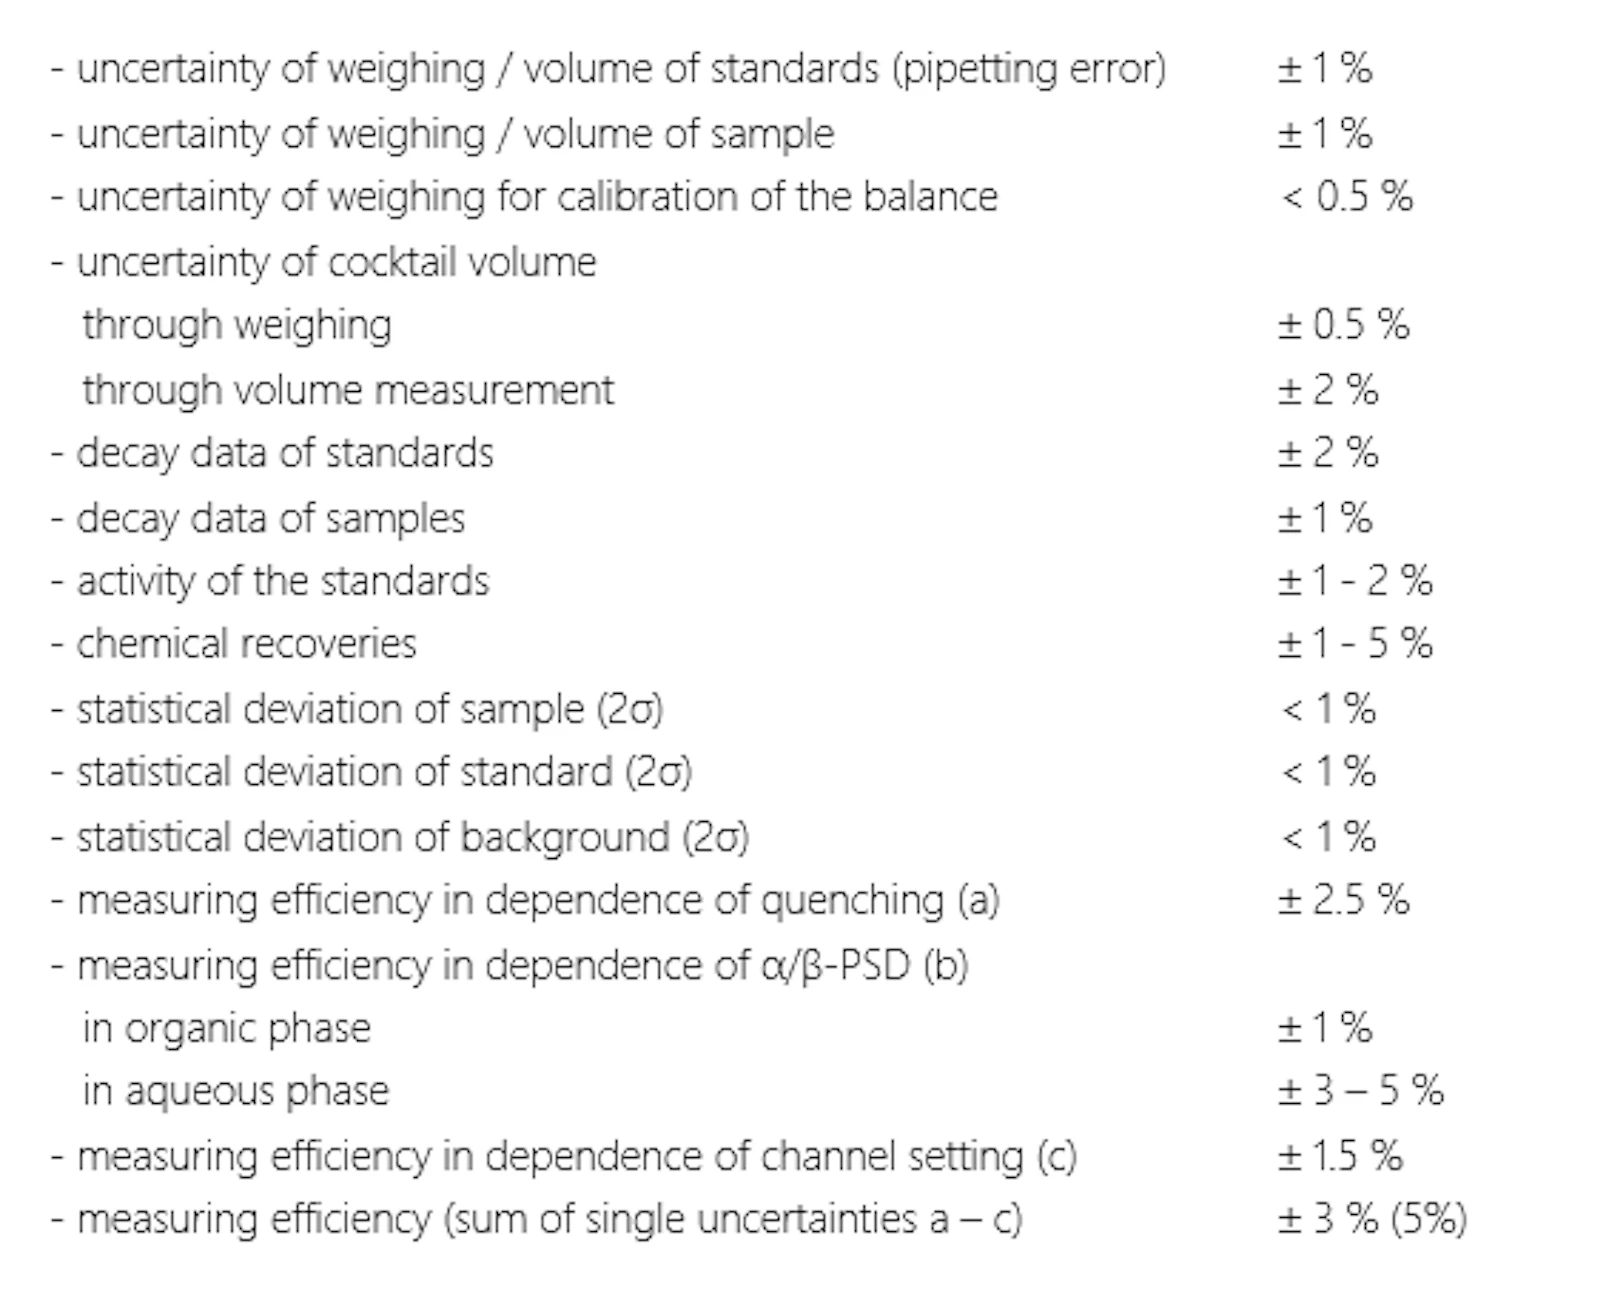
For the uncertainty budget of methods based on liquid scintillation counting, the following main parameters have to be considered for calculation. Values of relative standard uncertainty depend on the quality of the materials and the amount of the component. Some of the common parameters have been found to be

However, it should be taken into account, that the uncertainty associated to these variables depends on the value itself. Therefore for low weights, low count rates or low recoveries higher uncertainties should be expected. On the other hand, some parameters, even having high relative standard uncertainties, may have a low impact in the combined uncertainty. This concerns the background in the case of samples highly above the limit of detection or the chemical recoveries when they are close to 100%.
The steps that should be followed, when doing an estimation of the uncertainty, are:
Specify the measurand and how to calculate it
Identify sources of uncertainty and list it
Quantify the uncertainty associated to each component
Calculate combined uncertainty
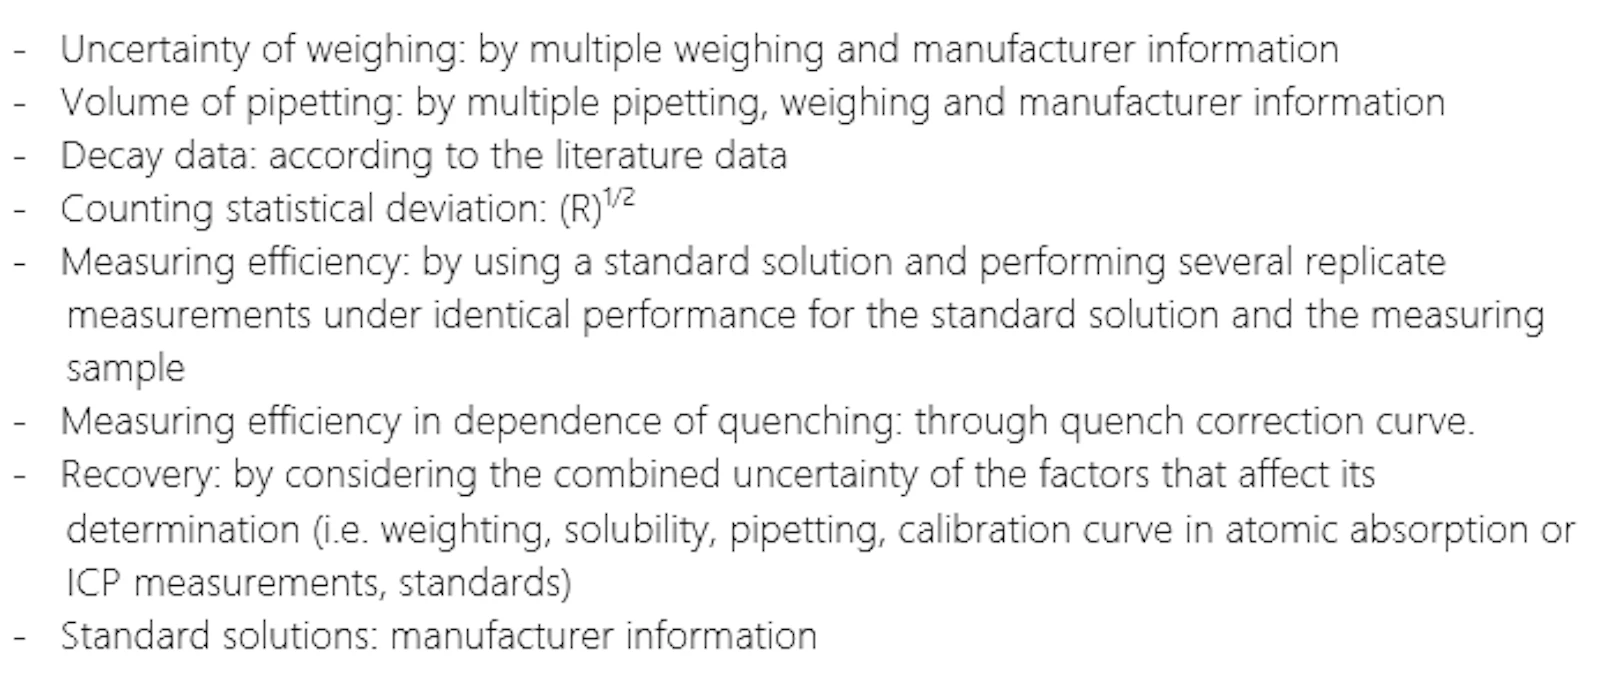
The quantification of the uncertainty associated to each component can be done on the basis of previous data, repetition of experiments, data from producers or through approximations. In this sense two type of uncertainty evaluations are identified:
Type A: method of evaluation based on statistical evaluation of a series of observations
Type B: method of evaluation based on a pool of comparatively reliable information
Combined uncertainty is calculated using the law of propagation of errors. For simplicity reasons, the uncertainties here are considered as being independent from each other.


where, u(y) (or U) is the combined uncertainty, u(xi) are the individual Type A or Type B uncertainties and ci are the sensitivity factors.
Thus, the uncertainty for the LS measurement in general has been calculated to be 4 to 6% according to the conditions.
Recently, Montecarlo simulation has been introduced as a way of calculating individual or combined uncertainties. Although this is a method of high complexity, there are some applications, like the “quench” package [Cassette 2016], that could be of help to determine the uncertainty associated to quench correction in liquid scintillation.
More detailed studies of uncertainty evaluation for various analytical procedures can be found in [Moreno et al. 1999] regarding Strontium determination by LS, in [Forte et al. 2006] about α- and β-indices in water, and in [De Regge and Fajgelj 2004] and [MARLAP 2004] for general hints for the uncertainty consideration.
Single components of the standard uncertainty have been quantified as follows:

For the total uncertainty budget, faults from sampling and sample preparation as main source of error have to be taken into consideration, if these faults cannot be avoided or correctly quantified.
In the case of 222Rn measurements, 5 % have been considered for losses during liquid/liquid extraction, when using a geometry of 8 mL water sample and 12 mL cocktail. Radon losses can considerably be higher, if the total volume of the liquid phase is less than 20 mL.
Incorrect calibrations, like not taking into account glass or plastic vials or the dependency on cocktail, can result in errors of up to 20 %. When quench correction for low and medium quenched samples is neglected up to 30 % error for low energy b-emitters and up to 15 % for medium and high energy b-emitters might result. This error can be diminished, when TDCR with three PM tubes is used (less than 5 % for 3H and medium quenched samples). Errors caused from wrong a/b-PSD measurement are due to not considering quenching effects on PLI level adjustment (e.g. different salt content) or to differences between radionuclides used in the calibration (e.g. 90Sr and 241Am) and the radionuclide in the sample. In this case, a 2 or 3 dimensional visualization plot will help recognizing and prevent faults.
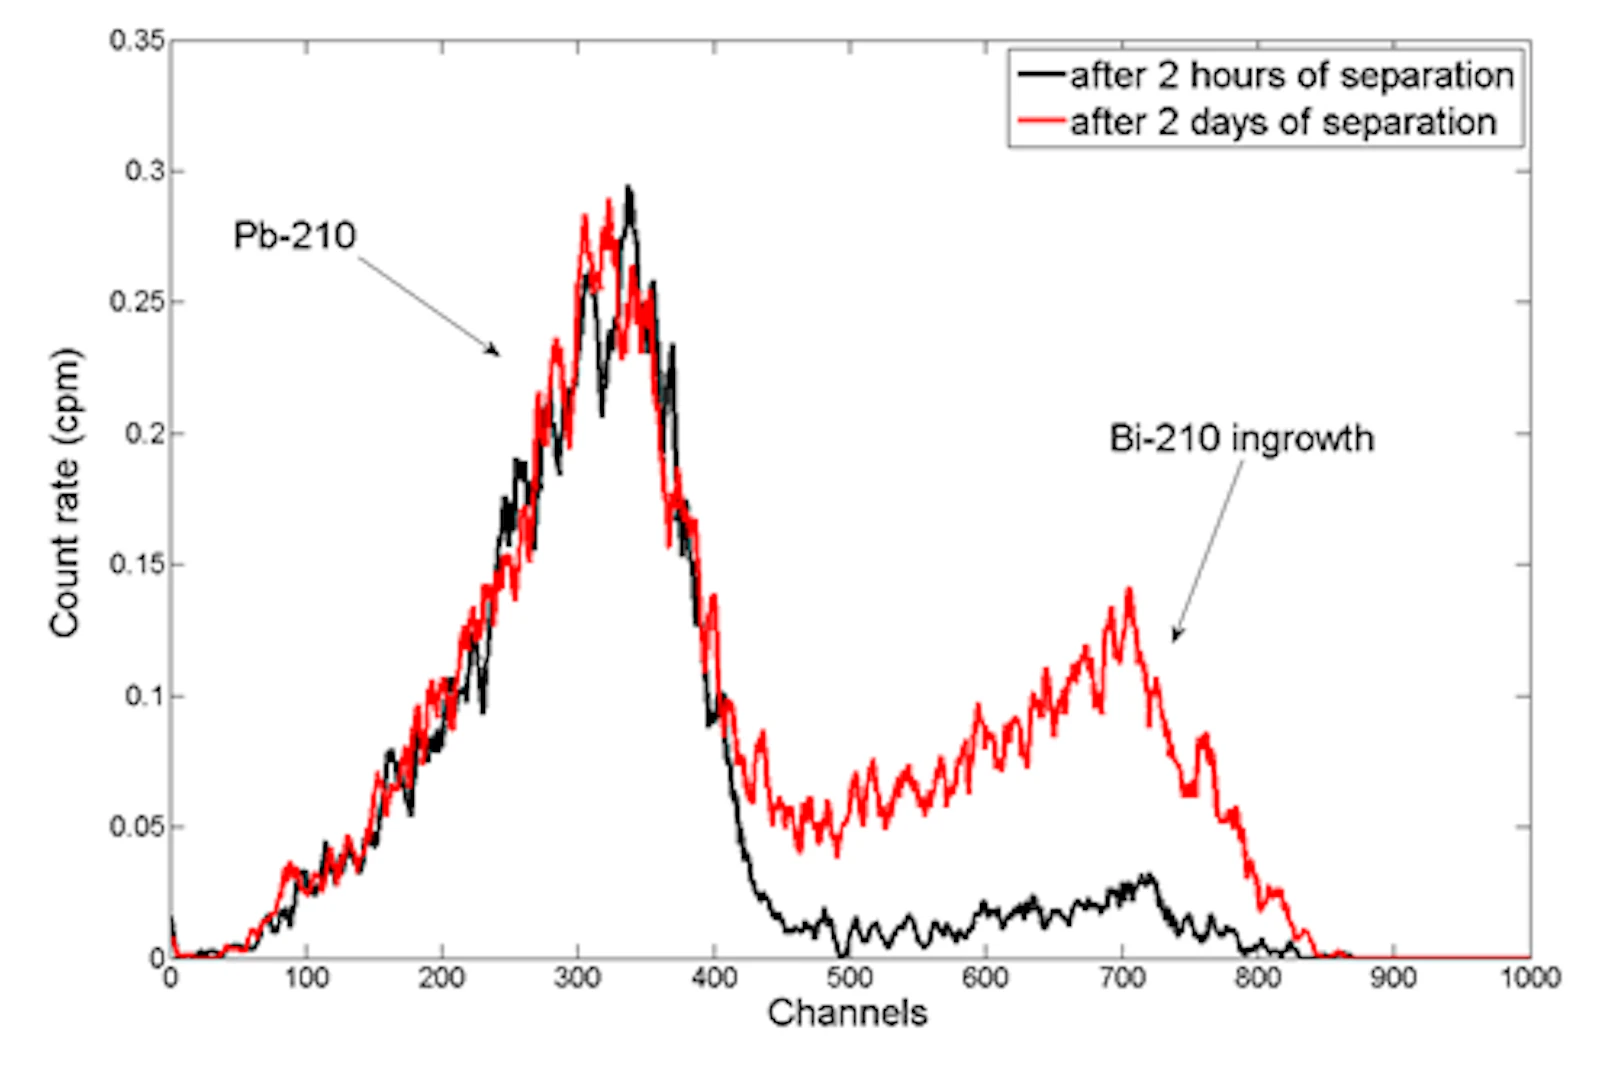
Further uncertainties result from handling radionuclides forming secular (e.g. 226Ra and 222Rn), or transient (232U as standard) radioactive equilibrium. A careful ingrowth correction is necessary for correct results (see 2.2.1.4.). In case of using 232U as standard solution (e.g. for isotope dilution analysis), a regular separation from ingrowing daughter nuclides is precondition (see also chapter 2.2.2.1.). On the other hand, when chemical separation is performed, ingrowth of daughter radionuclides should be avoided by counting the samples just after separation or by correction through the estimation of its contribution to the counting window (fig. 47).

Cassette P. 2016: QUENCH: A software package for the determination of quenching curves in Liquid Scintillation counting; Appl. Radiat. Isot. 109 (2016) 301-307
De Regge P. and Fajgelj A. 2004: Quantifying uncertainties in nuclear analytical measurements; International Atomic Energy Agency, TECDOC Series No.1401
Forte M., Rusconi R., Caresana M., Bellinzona S., Cazzaniga M.T. and Sgorbati G. 2006: The evaluation of uncertainty in low-level LSC measurements of water samples; Appl. Rad. Isotopes 64/10–11 (2006) 1124-1129
MARLAP 2004: MARLAP, (Multi-Agency Radiological Laboratory Analytical Protocols Manual), NUREG 1576, EPA 402-B-04-001A, NTIS PB2004-105421 (2004) 20-1
Moreno J., Vajda N., Burns K., Danesi P. R., De Regge P. and Fajgelj A. 1999: Quantifying uncertainties in the radiochemical determination of 90Sr in environmental samples by liquid scintillation counting; in: De Regge P. and Fajgelj A. The IAEA Guide on Quantifying Uncertainties in NAT, 1999

