2.2 - Hidex Biofuel method
Abstract
A novel method based on radiocarbon dating and liquid scintillation counting (LSC) was developed to determine the biocarbon content in biofuels without fuel specific background sample. Hidex biofuel method is an easy-to-use measurement that requires no sample preparation making it well suitable for fast in-house detection needs. It uses a patented algorithm to find the background count rate and counting efficiency of unknown biofuel samples with variable colour. Hidex biofuel method employs a liquid scintillation counter with triple-double coincidence ratio (TDCR) output and an external standard. The performance of the method was demonstrated by analysing several different types of biofuels with a bio-% ranging from 1 to 100%. Results showed an excellent correlation between Hidex biofuel method and accelerator mass spectrometry (AMS), with detection limit down to 1% biocarbon.
Introduction
Fossil based fuels are increasingly replaced by fuels of biologic origin, such as hydrotreated vegetable oil (HVO) and bioethanol. Percentage of biogenic component in fuel can be determined with accelerator mass spectrometry (AMS) and LSC measurement with benzene synthesis (ASTM D6866 and EN 16640 guidelines), both based on 14C dating principle. These methods provide accurate results but require expensive and time-consuming sample preparation. Direct detection by LSC is an attractive alternative as liquid fuel samples can be measured directly after mixing with scintillation cocktail (DIN 51637, ASTM D8473-22 guidelines and Hurt et.al., Energy Fuels, 35, 2, 1503–1510, 2021). Fuel samples are often highly variable and intense in colour, which is affecting both counting efficiency and background CPM. This is a challenge especially with fuel blends, as a fossil-based background sample with similar quenching properties is rarely available.
Hidex biofuel method is an improvement on the direct LSC measurement. The method includes an algorithm, that uses a combination of two different types of quench parameters (external standard TDCR = eTDCR and QPE) to detect simultaneously both colour and chemical quench in the sample. It calculates the background count rate without a fuel specific background sample. The same algorithm finds also counting efficiency for each sample. The method employs a 3-PMT LS counter enabling triple-double coincidence ratio (TDCR) output and an external standard. The biofuel algorithm is derived from background and efficiency quench curves with chemical and colour quenchers. TDCR and external standard quench parameters are used for the calculation of background and counting efficiency of unknown samples.
Materials and Methods
LSC measurement
Hidex automatic TDCR liquid scintillation counter
300 SL, 600 SL super low level or ULLA ultra low level models
Temperature control unit
Eu-152 external standard source
Calibration of the biofuel method
The biofuel method requires TDCR counter equipped with cooling and Eu-152 external standard source. The counter used in this study was Hidex 300SL super low level (425-020) instrument. The algorithm is derived from background and counting efficiency quench curves which are measured on-site. Each quench set includes 7 standards with variable amount of nitromethane for chemical quenching and 7 standards with variable amount of Sudan1 for colour quenching. Quench curve sets are available in Teflon coated plastic vials or in glass vials. The quench curve measurements should be started as soon as possible, preferably within two weeks of arrival but no earlier than two days after installation. Counting efficiency measurement (14 samples: Ef 1-14) takes about three hours. Background measurement (14 samples: Bg 1-14) takes about 4.5 days. After the calibration the algorithm is installed as MikroWin template (.par file) and is ready to use for routine analysis of the biofuel samples.
Note! The algorithm is specific:
for the instrument
for the quench curves
for the location of the instrument. Recalibration is required if the instrument is moved to another laboratory.
for the materials i.e. vial type and MaxiLight+ cocktail. Glass vials should be ordered from the same manufacturer to keep the background constant due to the possible variations of K-40 in the glass material.
Use of the method is limited to samples within the quench range of the algorithm calibration.
Sample preparation
Add 10 ml MaxiLight+ scintillation cocktail to 20 ml Teflon coated plastic vial or glass vial. Samples are always prepared in the same type of vials as used in the quench curves measurements. Use polycone lined caps with glass vials. Tare the weight of the vial on analytical balance. Add 10 ml biofuel sample directly to the cocktail. Measure and record the mass of the biofuel sample on analytical balance. Perform all weighing with vial cap on. Gently mix the sample with the cocktail. Enter the sample mass in grams to the biofuel para file. Very volatile samples (for example naphtha and gasoline) can be difficult to weigh. To ease the sample preparation, such samples can be cooled before weighing.
Wipe each vial with an antistatic wipe or with a moist cloth just before placing the vials on a tray inside the instrument. Check that the cooling is on (target temperature 17°C), and the temperature is 16-17°C. Let the samples cool down on the tray in dark at least for an hour or two before starting the measurement. Store the samples in a dark and cool place, preferably at 15-20°C.
Long measurement times (5-7 hours) are recommended for low activity biofuel samples, i.e. for fossil and mid to low bio-% samples. Shorter measurement time (for example 1h) can be used for scanning purposes. Check that Use External standard and Use Guard are both selected in advanced options. All samples are counted twice, first with the external standard automatically positioned under the detector chamber for the selected time (use 60 seconds for external standard counting time).
Note! External standard quench parameter QPE should be >600 and the predicted counting efficiency >30%. If these values are below the optimized range, the quenching can be reduced using less sample. Reduce the sample to cocktail ratio from 10 + 10 ml to 8 + 12 ml to 5 + 15 ml, or experimentally even lower. The algorithm template will indicate with red flags if some of the samples have too low QPE and/or counting efficiency and need more dilution.
Quick QPE scan of the samples is suggested to ensure that all samples are in the optimal quench level before starting the long measurements. Quick QPE scan uses only 60 seconds counting time for external standard and a few seconds for sample avoiding hours counting of overly quenched samples.
Calculation of bio-%
All results are calculated in the MikroWin biofuel algorithm template (.par file). The counts are collected from optimized luminescence free triple coincidence ROI. Background count rate and counting efficiency are predicted using the algorithm and are found in Results-tab. The fuel mass and the carbon content are entered to the corresponding matrices in the biofuel para file before or after the measurement. Background count rate (Background) is subtracted from the count rate of the samples (CPM) and converted to absolute activity (DPM) by dividing with counting efficiency (Efficiency).

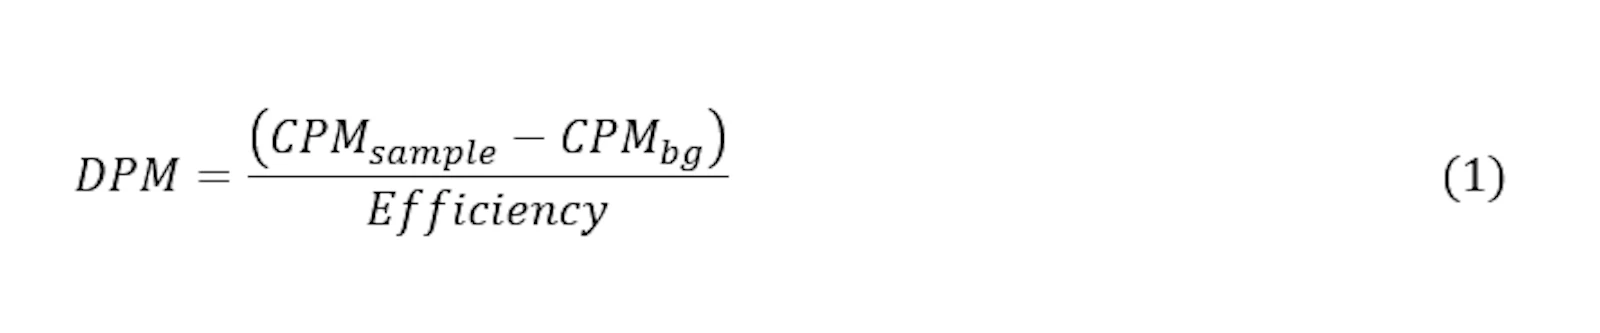
Biobased carbon content (Bio-%) is calculated using carbon mass-% of the biofuel (grams of biofuel * carbon content, cc) and assuming that the specific 14C activity of carbon is 13.56 DPM/g.

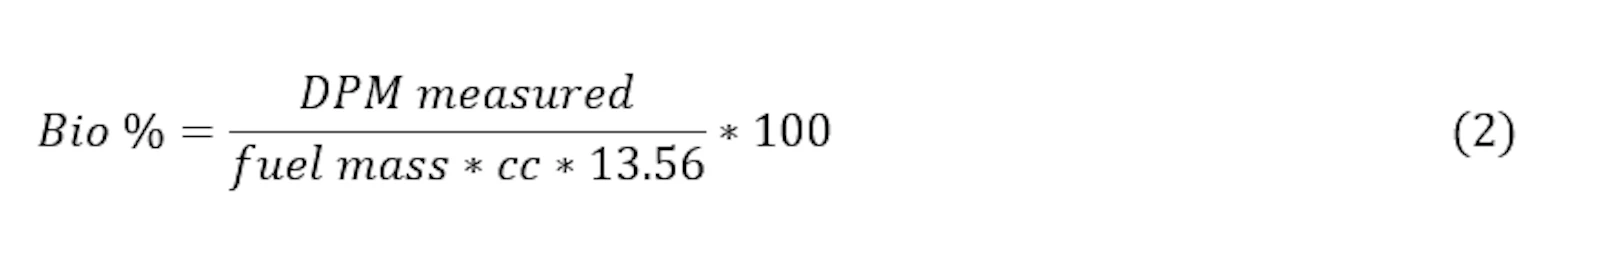
DPM comes from the biocomponent only, so

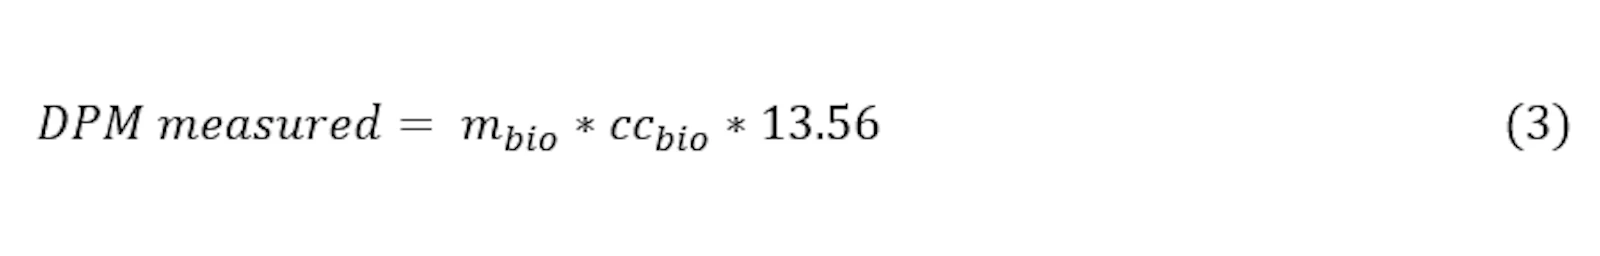
where m means mass (g). The carbon content cc is determined with Total Organic Carbon (TOC) analyzer. In Hidex biofuel method, biomaterials are assumed to be from 2019 or later. Instructions for bio-% correction of older biomaterials can be found in ASTM D8473-22 section 14.3.1.1. For example, biofuels manufactured from tens of years old wood-based material could result bio-% >100%. In this case the specific activity is higher than 13.56 DPM/g, probably near 15 DPM/g (see table 2.).
Results and Discussion
Hidex biofuel method has been tested with various types of fuels and their blends. Here we present results from in-house prepared HVO-diesel samples (Table 1.) and from biofuel samples received as unknowns (Tables 2. and 3.). The samples were prepared by mixing 10 ml of fuel with 10 ml of MaxiLight+ cocktail and analysed for 7h. Some of the kerosene samples were diluted due to the very intense colour. Bio-% was calculated according to equation 2.
Table 1. Comparison of HVO-diesel blends: expected bio-% versus bio-% determined using Hidex biofuel method (with ±1σ uncertainty).
| Expected Bio-% |
LSC Hidex Bio-%* |
| 100 | 99.0 ± 0.7 |
| 78.8 | 76.8 ± 0.6 |
| 57.7 | 57.7 ± 0.6 |
| 38.5 | 37.7 ± 0.5 |
| 19.2 | 18.9 ± 0.4 |
| 13.9 | 13.8 ± 0.3 |
| 9.4 | 9.8 ± 0.3 |
| 4.6 | 4.3 ± 0.3 |
| 2.7 | 2.7 ± 0.3 |
| 0.9 | 1.2 ± 0.3 |
| 0 | -0.2 ± 0.2 |
Table 2. Biofuel comparison study with AMS and Hidex biofuel method. All samples were received as unknowns. *The specific activity of very old wood-based material is higher than 13.56 DPM/g used in the calculation. **If fossil methanol is used in the production of FAME, the bio-% is 93-95% of expected. For more information see chapter Notes on FAME.
| Composition | Expected bio-% | AMS University | LSC Hidex |
| 100% HVO | 100 | 101.2 ± 1.2 | 100.2 ± 0.8 |
| 100% HVO | 100 | 100.9 ± 1.2 | 99.6 ± 0.8 |
| 100% HVO | 100 | 100.7 ± 1.2 | 100.4 ± 0.8 |
| 100% HVO | 100 | 100.1 ± 1.2 | 103.1 ± 1.0 |
| 100% HVO (woody biomass) | 100* | 111.0 ± 1.4 | 106.4 ± 0.7 |
| 70% diesel 7% FAME, 23% HVO | 30** | 25.3 ± 0.3 | 26.7 ± 0.9 |
| 70% diesel 7% FAME, 23% HVO | 30** | 28.6 ± 0.4 | 25.7 ± 0.9 |
| 70% diesel 15% FAME, 15% HVO | 30** | 29.8 ± 0.4 | 30.1 ± 0.4 |
| 100% diesel | 0 | 0 | 0.1 ± 0.3 |
| 100% FAME | 100** | 95.4 ± 1.2 | 95.6 ± 0.9 |
| 100% GTL (fossil) | 0 | 0 | -0.1 ± 0.3 |
| 90% diesel, 10% HVO | 10 |
|
9.8 ± 0.3 |
| 95% diesel, 5% HVO | 5 |
|
5.0 ± 0.3 |
| 100% bio-naptha | 100 |
|
96.6 ± 0.9 |
| 80% petrol, 10% ethanol, 10% bionaptha | 20 |
|
17.1 ± 0.4 |
Table 3. Low bio-% kerosene samples were analysed with AMS and Hidex biofuel method. All samples were received as unknowns.
| Low bio-% kerosene samples | AMS Bio-% | Hidex Bio-% | Cocktail to sample ratio |
| Fossil / “0%” |
|
0.29 ± 0.31 | 10+10 ml |
| Unknown sample | 1,87 | 1.50 ± 0.33 | 10+10 ml |
| Unknown sample | 0,72 | 0.76 ± 0.29 | 10+10 ml |
| Unknown sample
*Too dark (extreme colour quench) |
1,25 | N/A* | 0.5+19.5 ml |
| Unknown sample | 3,98 | 5.49 ± 0.46 | 10+10 ml |
| Unknown sample | 3,04 | 4.3 ± 0.63 | 5+15 ml |
Role of carbon content in bio-% of blends
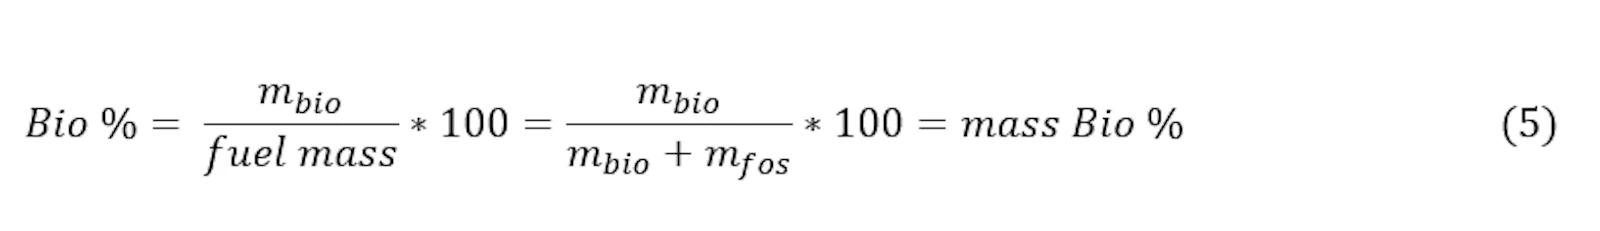
Sometimes when measuring blends of low-carbon content biocomponents, e.g. FAME (cc 0.77) and bioethanol (cc 0.522), the bio-% result is lower than that expected from their masses in blend. A possible reason is that the carbon content of the total blend (cctot) is used in bio-% calculation which yields pMC = percent modern carbon = percent biocarbon of all carbon in blend. With low-cc biocomponents pMC is lower than mass-bio-% because the biocomponent brings less carbon per weight to the blend than high-cc fossil component. To get the mass-bio-%, only the cc of biocomponent (ccbio) should be used.
Mass Bio-% = percent of biocomponent mass of all fuel mass.
Carbon content = ccbio = cc of biocomponent only.
Inserting equation 3 to equation 2 leads to

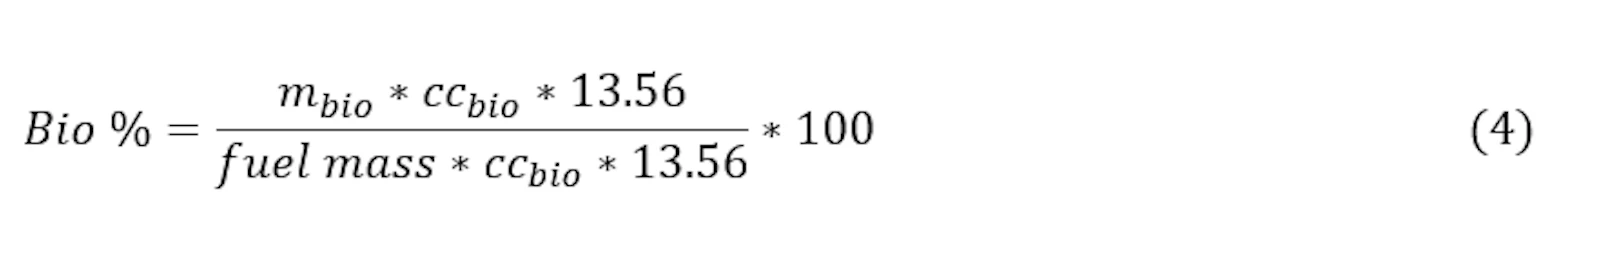
Most terms cancel out and

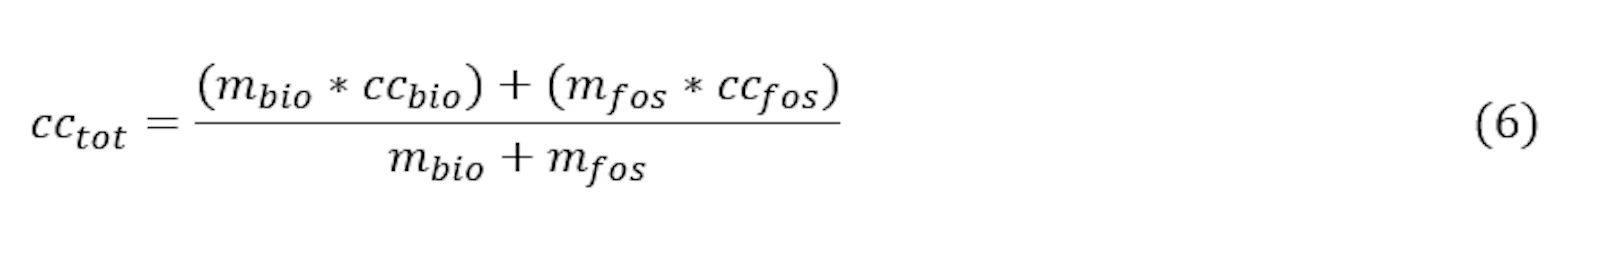
pMC = percent modern carbon = percent of biocarbon of all fuel carbon.
Carbon content = cctot = carbon content of blend.
This can be written
In equation 6 ccfos means the carbon content of fossil component. Inserting equation 6 to equation 2 leads to cancellation of fuel mass mbio+mfos, leaving

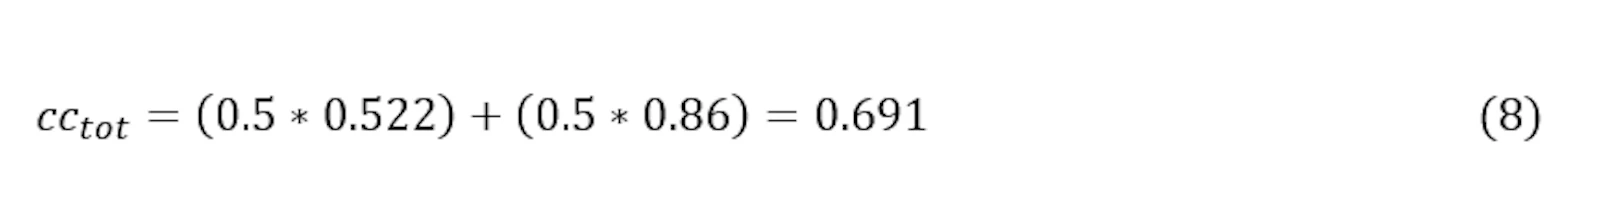
Bio-% calculation example
8 g of blend containing 50 m-% bioethanol (ccbio = 0.522) in fossil fuel (ccfos = 0.86) was measured, i.e. there is 4 g of bioethanol and 4 g of fossil fuel.


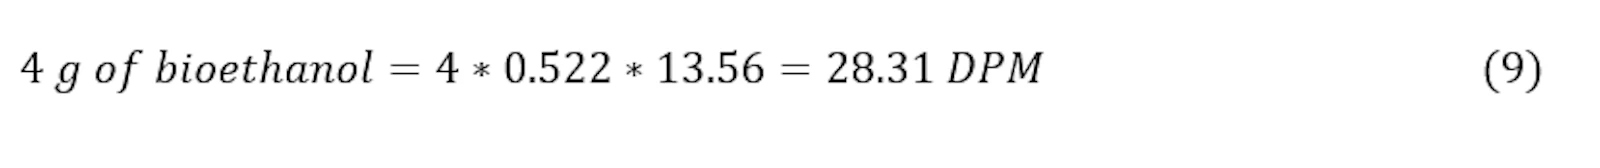
So, if an unknown bioethanol sample of 8 g gave 28.31 DPM, following calculations could be done.

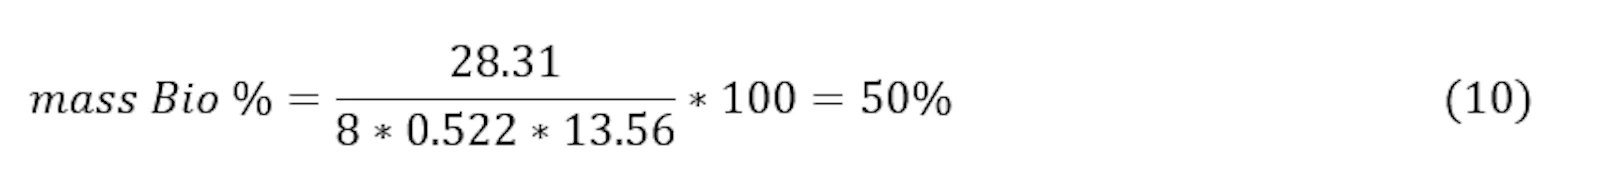
➜ Interpretation 1: 50% of blend mass was bioethanol.

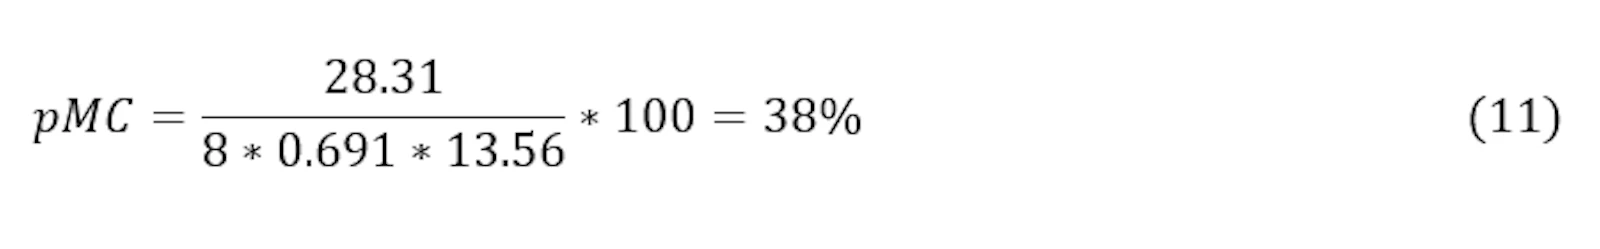
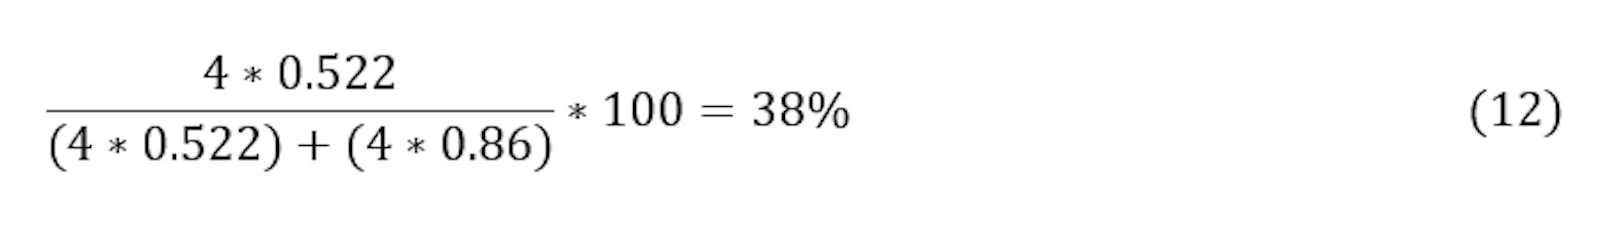
➜ Interpretation 2: 38% of blend carbon was biocarbon as it should be:

Unknown carbon content
If the carbon content of the fuel is unknown or cannot be determined, the proportion of the biocomponent can be reported as biocarbon mass of all sample mass. This is much more informative than just a CPM or DPM value.


From the equations 13 and 14 it is easy to see the relation between the mass ratio and bio-%.


Carbon content summary
If carbon content of the biocomponent ccbio is used in the calculation, the bio-% is biocomponent mass-% of all blend mass, i.e. mass-bio-%, m-bio-%.
If carbon content of total blend cctot is used in the calculation, bio-% is pMC, percent modern carbon, or percent of biocarbon of all carbon in blend.
pMC = biobased carbon content
If blend is totally unknown and cc measured separately, it produces cctot and hence bio-% is pMC.
If ccbio < ccfos, pMC < m-bio-%.
If ccbio = ccfos, pMC = m-bio-%.
AMS results are reported as pMC ➜ lower than m-bio-% in blends of low-cc biocomponents such as bioethanol and FAME.
Notes on FAME
FAME (Fatty Acid Methyl Ester) is the generic chemical term for biodiesel derived from renewable sources. FAME is produced by transesterification of vegetable oils with methanol. Recently it has come to our attention that the FAME production uses likely petroleum sourced methanol. The ester methyl of FAME comes from methanol. So, if this methanol is fossil, and assuming FAME molecules are typically 15-20 carbon atoms, biocarbon-% is 93-95% of expected.
A carbon content 0.77 is generally used for calculating the bio-% of FAME. If one of the FAME carbon atoms is fossil based, 0.77 is not the carbon content of the biocomponent cbio only, but rather the total carbon content ctot of blend. This could explain why some LSC bio-% results are often slightly too small for FAME.
According to DIN 51637:2014-02 section 10.3, knowing the average molecular chain length (lav) of 17.71, the carbon content of biocomponent can be calculated using equation 13.


If the exact type of FAME (fatty acid distribution or average chain length) is known, this value can be used in the calculation (e.g. for rapeseed methyl ester RME lAV = 17.80).
Bioethanol and biomethanol
Hidex biofuel method is based on non-polar MaxiLight+ cocktail. It is therefore applicable for bioethanol and its blends as well as for all non-polar biobased fuels. Methanol, on the other hand, is polar molecule that does not dissolve in MaxiLight+ cocktail, so Hidex biofuel method is not suitable for pure biomethanol applications as such.
However, the direct LSC method is well suited for bioethanol and biomethanol, since fuel specific fossil background samples are available for both. The counting efficiency can be determined with C-14 radioactive spiking. If the background and efficiency are constant (all samples are similar), the same values can be used in all measurements and there is no need to define them again in every measurement. For biomethanol applications we recommend AquaLight+ cocktail, which is a general-purpose scintillation cocktail for aqueous and non-aqueous samples.
Here is the procedure for biomethanol in short:
Efficiency:
Add 10 ml of AquaLight+ cocktail in a vial.
Add small volume (20-200 µl) of C-14 solution for example in toluene, preferably 5000 - 10 000 DPM. Exact C-14 activity needs not to be known.
Set coincidence time 35 ns to ensure exact DPM determination.
Measure the activity in open window 5-650 for 10 min.
Calculate the DPM with TDCR: DPM = CPM/TDCR.
Add 10 ml of methanol to the same vial.
Set coincidence time 20 ns to reduce background and get robust measurements. Keep the coincidence time 20 ns henceforth.
Measure the activity in triple ROI T100-400 for 10 min.
Calculate the Eff = CPM ROI T100-400 / DPM ROI 5-650.
Background:
Background sample: Add 10 ml AquaLight+ cocktail + 10 ml fossil methanol in a vial.
Measure the background sample in triple ROI T100-400 for 5-7 hours (if possible, do several repeats and use the average value).
Unknowns:
Unknown sample: Add 10 ml AquaLight+ cocktail + 10 ml unknown biomethanol sample in a vial. Weigh the mass of the biomethanol sample.
Measure the biomethanol sample in in triple ROI T100-400 for 5-7 hours.
Calculate the biomethanol DPM = (biomethanol CPM T100-400 - background CPM T100-400) / Eff
Calculate the bio-% = biomethanol DPM / (mass of biomethanol * carbon content * specific activity) * 100.
CONCLUSIONS
Our aim was to develop a new, easy-to-use, direct LSC measurement for determining the bio-% of biofuels. The Hidex biofuel method was tested with different types of fuels whose bio percentage varied between 1 and 100%. The method is based on an algorithm which is derived from background and efficiency quench curves with chemical and colour quenchers. The algorithm uses TDCR and external standard quench parameters for finding the background and counting efficiency of unknown samples. A fuel-specific background sample is not required. The Hidex biofuel method expands the applicability of direct LSC. The results presented here show that it is suitable for a wide range of fuel types and their blends, as well as for coloured fuels. The bio percentages determined with the Hidex biofuel method were very well in line with the corresponding AMS results.
SUMMARY
Direct in-house measurement of bio-%
No need for a fuel specific background sample
Minimal sample preparation
Suitable for wide variety of fuel types, and their blends with variable colour
No luminescence interference
Detection limit down to 1 % biogenic content
Dilution recommended for the highest colour intensity samples